
ISSN 2410-5708 / e-ISSN 2313-7215
Year 10 | No. 29 | October 2021- January 2022
© Copyright (2021). National Autonomous University of Nicaragua, Managua.
This document is under a Creative Commons
Attribution-NonCommercial-NoDerivs 4.0 International licence.

Fluctuations in pH, alkalinity, dissolved oxygen and nutrient in Cayos Miskitos, municipality of Puerto Cabezas, North Atlantic Autonomous Region (NAAR)
https://doi.org/10.5377/rtu.v10i29.12743
Submitted on July 17, 2020 / Accepted on June 22, 2021
M.A. Yader Santiago Caballero Arbizú
Bachelor of Chemistry
Master in Water Sciences with emphasis on Quality of the Agua
National Autonomous University of Nicaragua, Managua
Center for Research in Aquatic Resources of Nicaragua. CRAR
Environmental Radiochemistry Laboratory
Section: Sciences
Scientific Articles
Keywords: Ocean acidification, alkalinity, nutrients, physical - chemical parameters.
This study was financed by the Funds for Research Projects (FPI), granted by the National Autonomous University of Nicaragua (UNAN-Managua), and the Center for Research in Aquatic Resources of Nicaragua.
Abstrast
Ocean acidification is the drop in pH caused by the absorption of anthropogenic carbon dioxide produced by the combustion of fossil fuels, among other human activities, increasing the acidity of water and decreasing the availability of carbonates, which threatens the survival of Calcareous marine species: corals, oysters, crabs and lobsters, among others. These effects constitute a threat in the Nicaraguan Caribbean, so a monitoring of the physical-chemical parameters of the water was carried out in Cayos Miskitos (Puerto Cabezas, Autonomous Region of the North Atlantic, RAAN) in July, September and November 2018; February and March 2019. The samplings were carried out with the collaboration of IREMADES-URACCAN technicians. The physical-chemical parameters measured were: pH, total alkalinity, dissolved oxygen and nutrients; they were analyzed by standard methods. The pH presented normal values for seawater (8.05 and 8.19 pH units), while alkalinity showed values slightly above the typical values for seawater (118 to 124 mg / l-1 as CaCO3). NTD concentrations at all sampled sites represented approximately 50% of NT concentrations, while the presence of FT, FTD and FRD is due to the phenomenon of outcrop to the surface of deeper waters. These results highlight the importance of studying pH and alkalinity to know its impact on the evolution of ocean acidification and its effects to support policies aimed at mitigating the phenomena of warming and adaptation to climate change.
1. INTRODUCTION
Ocean acidification is the decline in the course of pH in Earth’s oceans, caused by the absorption of anthropogenic carbon dioxide from the atmosphere. It is estimated that since the industrial revolution the pH has decreased by 0.1 units, a trend that in recent decades has been maintained at a rate of -0.0014 to -0.0024 per year (IPCC, 2013).
Human activities such as, changes in land uses, the combustion of fossil fuels is and the production of cement has meant a new contribution of carbon dioxide (CO2) to the atmosphere. The ocean plays an important role in the absorption of atmospheric CO2, When CO2 is absorbed by the ocean it reacts with water and a balance is formed between ionic and non-ionic chemical species: free CO2 in solution, carbonic acid (H2CO3), bicarbonate (HCO3-) and carbonate (CO32-). A large increase in CO2 decreases the pH of sea surface water by increasing acidity, decreasing the availability of carbonates, which threatens the survival of many marine species, mainly calcareous organisms such as corals, sea stars, oysters, crabs, prawns, mussels, lobsters and other marine species such as macro algae communities, sea grass meadows and mangrove ecosystems (Waycott et al,2007; Brierley & Kingsford, 2009; Porzio, Buia, & Hall. 2011; Comeaux, Mead, & Bianchi, 2012; Jennerjahn, 2012).
The main effects of water acidification, as well as rising sea levels, constitute potential threats to ecosystems in Nicaragua’s Caribbean maritime areas, because many families depend on fishing, so the health of the ecosystem must be conserved and preserved. According to Humbolt (2008), of every ten seafood products exported by Nicaragua, five come from the autonomous region of the Caribbean, so it is important to develop water quality monitoring programs in miskitos Keys in the Caribbean Sea, with the aim of knowing the fluctuations of pH, alkalinity, dissolved oxygen and nutrient and create a database that allows, to contribute to the exploration of the signals of ocean acidification and its impact on marine and coastal ecosystems in the maritime territory of the Caribbean.
2. METHODOLOGY
The Miskitos Keys are located in the northeast of Nicaragua, municipality of Puerto Cabezas, North Atlantic Autonomous Region (NAAR), at an approximate distance of 560 km from the city of Managua. For the estimation of ocean acidification, point measurements were made in various periods of physical and chemical parameters in the water at two study sites in Miskitos Keys. The samples were collected following the recommendations of project RLA7020 “Base line study for the evaluation of acidification in the Caribbean of Nicaragua using nuclear and isotopic techniques”, in Cayos Miskitos (Puerto Cabezas) in the months of July, September and November 2018; February and March 2019, at two sampling sites: Pto 1. northeast Cayo Mayor Miskitos and Pto 2. Northeast Cayo Mayor Miskitos (Fig. 1).
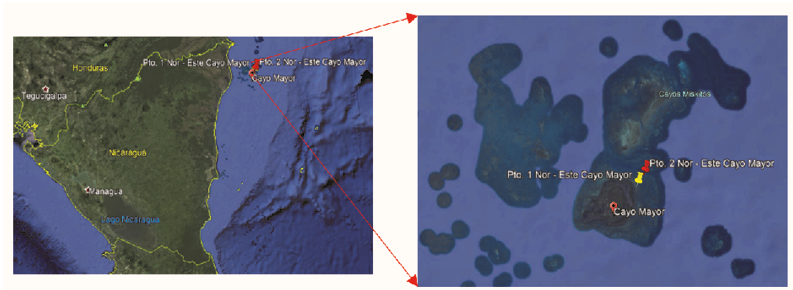
Figure 1.
Location of sampling points for the collection of water samples in Miskitos Keys (RAAN).
Water samples were taken using a Van Dorn bottle to perform analyses of pH, total alkalinity, dissolved oxygen (DO) and nutrient (total nitrogen (TN), total dissolved nitrogen (TDN) , ammonia nitrogen (N-NH3), total phosphorus (FT), total dissolved phosphorus (TDP), dissolved reactive phosphorus(DRP). The water samples were collected and preserved following field procedures by technicians and specialists from the University of Autonomic Region of the Nicaraguan Caribbean Coast (URACCAN), then transported to be analyzed following the Standard Operating Procedures (SOP) of the Natural Water Laboratory of CIRA/UNAN according to the Standard Methods for the Examination of Water and Wastewater. 22 nd Edition (Table 1). As a quality test for physical and chemical analyses, standards recovery tests were established to verify the good performance of analytical techniques, targets, control samples and duplicates.
Table 1.
Methods used in physical and chemical analyses of water.
|
Physical- chemical parameters analyzed |
Methods |
|
pH |
4500.H+B. Electrometric Method |
|
Total Alkalinity as CaCO3 |
2320 B. Titrimetric method |
|
Dissolved oxygen |
4500 O.C1 |
|
Total Nitrogen |
Second Derivative2 |
|
Dissolved Organic Nitrogen |
Second Derivative2 |
|
Ammonia Nitrogen |
4500-NH3F1 |
|
Total Phosphorus |
4500-P.B.E1 |
|
Total Dissolved Phosphorus |
4500-P.E1 |
|
Dissolved Reactive Phosphorus |
4500-P.E1 |
1. American Public Health Association (APHA, 2012) Standard Methods for the Examination of Water and Wastewater. 22 nd Edition. Washington APHA.
2. (Crumpton, Isenhart, & Mitchell, 1982) Nitrate an Organic N analysis with second derivate spectroscopy. Limnology & Oceanography 37-907-913.
3. RESULTS AND DISCUSSION
3.1. pH
The pH values in the 2 months studied in Pto 1 reached a minimum value of 8.03 in September 2018 and a maximum of 8, 19 in March 2018, while in the 4 months sampled in Pto 2 the pH registered a minimum value of 8, 05 in September 2018 and February 2019 and a maximum in March 2019, coinciding with the maximums in Pto 1 and Pto 2 in March 2019 (Fig. 2).
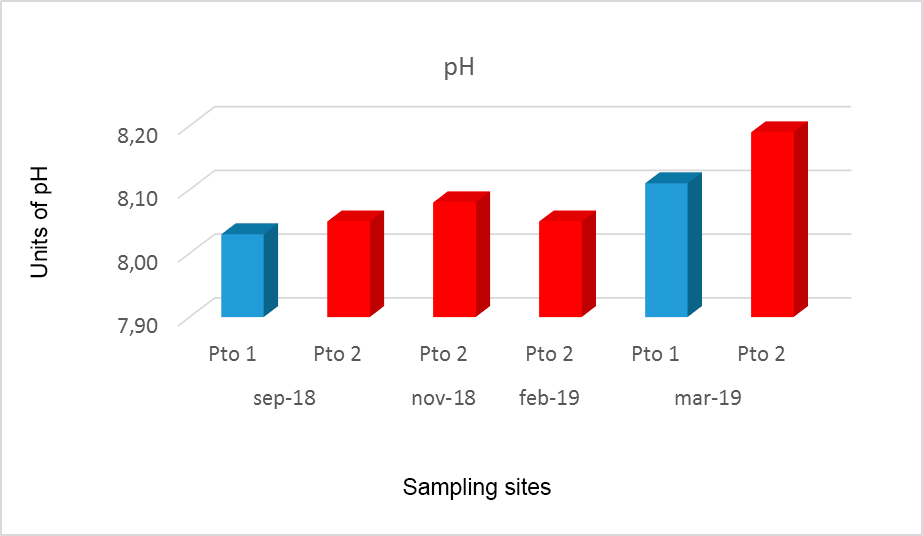
Figure 2.
pH values obtained at the sites sampled in Miskitos Keys (Puerto Cabezas) in the dry and rainy season.
In general, seawater is slightly alkaline and the value of its pH is between 7.5 and 8.4 pH units and varies depending on the temperature; if it increases, the pH decreases and tends to acidity; also, it can vary depending on the salinity, pressure or depth and vital activity of marine organisms (Cifuentes, Torres, & Frías, 1997). The pH behavior at the two sites sampled in this study is among the normal values for seawater. Pto 2 showed a significant increase in March 2019 at both sampled sites, being slightly alkaline when compared to the sites sampled in this study.
In seawater the anions HCO3- and CO32- present high concentrations that give rise to alkaline pH between 7,5 and 8.5 units of pH (De La Lanza Espino, 2001). It should be noted that the pH values obtained in all the sampled sites could be related to increases in water temperatures, which favored the precipitation processes of CaCO32- and that would explain the pH obtained in this study. The pH in all the months sampled had no major changes in time and space. The pH found in this study is similar to that reported by (Delvalls, 1999) in more distant areas of the coast which found pH values of 8.3 pH units.
3.2. Alcalinity
The alkalinity values found are quite similar in Pto 1 and Pto 2 in all months sampled with an average value of 86.83mg.l-1 and 101.45 mg.l-1 respectively (Fig.3). Pto 2 presented the highest alkalinity values with 124 mg.l-1 in November 2018 and 124, 01mgl-1 in February 2019. This situation could reflect an increase in productivity resulting in a greater elimination of CO2 from the water column (Delvalls, 1999) that together with increases in water temperature would favor the precipitation processes of CaCO32- and that at the same time would explain the pH values found in this study.
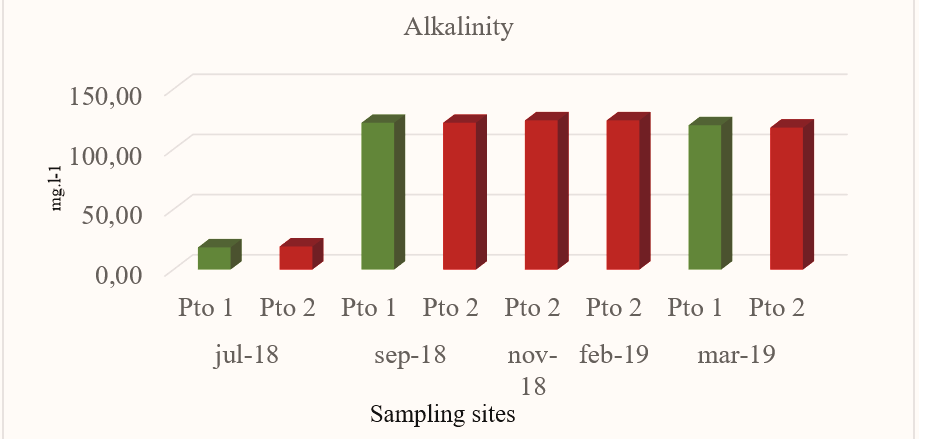
Figure 3.
Alkalinity values obtained at the sites sampled in Miskitos Keys (Puerto Cabezas) in the dry and rainy season.
The balance of the ionic forms, bicarbonate and carbonate is controlled by the pH, being found that at high pH between 7.00 and 9.00units of pH bicarbonates predominate (De La Lanza Espino, 2001). Alkalinity depends essentially on the concentrations of bicarbonates, carbonates and hydroxides (Ramírez & Viña, 1998). The primary components of the alkalinity of aquatic systems, carbonate and bicarbonate stabilize the pH about 8 which is beneficial for most aquatic plants and animals; therefore, the alkalinity found in Pto 1 and Pto 2 in this study is strongly related to the pH found at all sampled sites (8.03 – 8.19 pH units). The alkalinity found in this study is slightly above the values of seawater which establishes a total alkalinity of 100 ppm CaCO3 (Custodio & Llamas, 2001).
3.3. Dissolved Oxygen
Dissolved oxygen (DO) is considered one of the most important variables for the survival of fish and other aquatic life organisms within seawater (Bustos, 2003). Do concentrations found at all sites sampled in the rainy and dry season presented a minimum of 7.50 mg.l-1 in February 2019and a maximum of12.06 mg.l-1 in November 2018 and March 2018(Fig.4). The highest concentrations of DO in this study were found in Pto 2 compared to those recorded in Pto 1. The behavior of the DO in this study could be related to the circulation of water masses, photosynthetic activity, temperature, salinity and the balance with the amount that exists in the atmosphere being its high values.
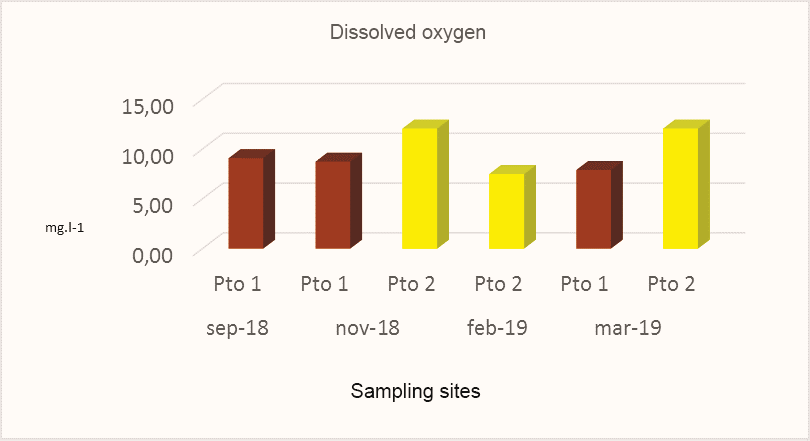
Figure 4.
Dissolved oxygen concentrations obtained at the sites sampled in Miskitos Keys (Puerto Cabezas) in the dry and rainy season.
The D.O. Concentrations obtained during the study were optimal for aquatic biota with values between 7.50 mg.l-1 and 12.06 mg.l-1. The behavior of dissolved oxygen in this research varied with respect to that found by CIMAB (2010), which showed values between 6.20 mg l-1 and 7.06 mg l-1. It is relevant to mention that the variability of the levels of dissolved oxygen in the sea occurs depending on the temperatures of the different geographical areas and the concentrations of dissolved oxygen are greater or increase as they move away from the coast. The minimum values found in the upwelling areas are 1 ml/l and in the areas of great photosynthesis it is common to find values of 8.5ml/l (Bustos, 2003).
3.4. Nutrients
3.4.1 Nitrogen
Total Nitrogen
Nitrogen is the gas found in greater proportion in the sea, but due to its inert nature it does not intervene in the biological cycle of nitrogenous substances, although there are certain bacteria in the sea that are capable of producing it and others of fixing it (Cifuentes, Torres, & Frías, 1997). The Total Nitrogen (TN) in Pto 1 ranged from 1,245 mgl-1 to 4,737mg.l-1, while in Pto 2 it ranged from 2,096 mg.l-1 to 7,986 mg.l-1, obtaining in both sites the highest value in November 2018 (Fig.5).
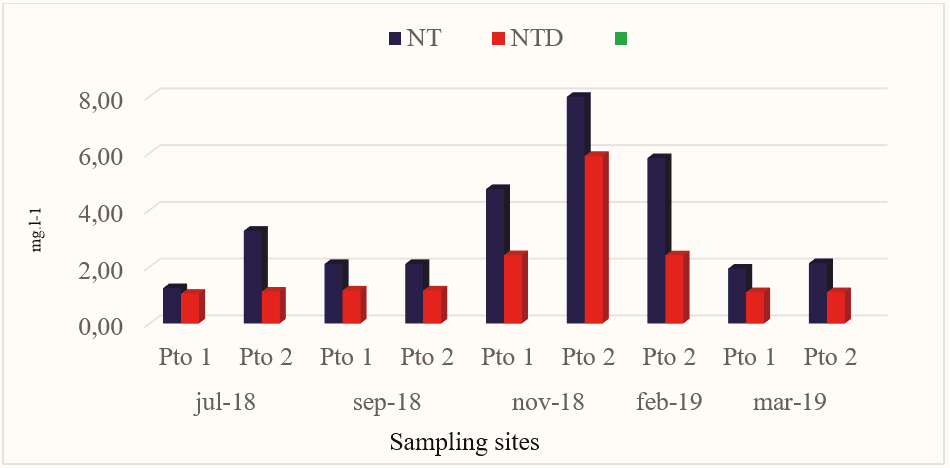
Figure 5.
Nt and NTD concentrations obtained at the sites sampled in Miskitos Keys (Puerto Cabezas) in the dry and rainy season.
Overall, the average total concentration of nitrogen in the ocean is 11.5 ppm, of which 11 ppm is in the form of N2 (CCO, 2013). In this research the NT showed a defined pattern for the months of July 2018, September 2018 and March 2019, however, it presented changes in its concentrations for the months of November 2018 and February2019. The distribution of nitrogen depends on temperature, salinity, the circulation of the mixing processes (nutrients come back to the surface, by rising water currents, which occur when the temperature of the different bodies of water changes, in the so-called upwelling or upwelling zones, where it is take nor by organisms in the fotic zone), the diffusion that takes place in oceanic waters and by the excretions and death of marine plants and animals (Cifuentes, Torres, & Frías, 1997). This situation shows that the TN in November 2018 and February 2019 in Pto 1 and Pto 2 comes to the surface again, by rising water currents, by the excretions and death of marine plants and animals. The TN concentrations in this study were higher when compared to those found in CIMAB (2010) because they presented a heterogeneous horizontal distribution pattern, with extreme values ranging from 1.524 mg.l-1 to 0.753 mg.l-1.
Total Dissolved Nitrogen (TDN)
Total Dissolved Nitrogen (TDN) concentrations in Pto 1 ranged from 1,043mg.l-1 to 2,406 mg.l-1, while for Pto 2 concentrations ranged from 1,102 mg.l-1 to 5,903 mg.l-1 (Fig. 5). It is important to note that in both sampling points the highest concentrations were presented in the month of November 2018, with Pto 2 being the one that presented the highest concentration of TDN for this study very close to the average value of 2,177 mg.l-1.
NTD concentrations at all sampled sites accounted for approximately 50% of TN concentrations (Fig.5). The TDN showed a very varied distribution pattern between points and times sampled, possibly caused by the rising water currents that occur when the temperature changes in the study area. According to Cifuentes, Torres, & Frías(1997), the circulation of water in the sea intervenes in the concentration of nutrients.
Ammoniac AL nitrogen
Ammonia nitrogen concentrations represented a small fraction of the total nitrogen concentration, indicating that it is mainly represented by newly sourced organic nitrogen containing large amounts of unassimilated organic matter. The results of Ammonia Nitrogen in Pto 1 and Pto 2 registered variations between the months sampled, obtaining the highest values in March 2019 with 0.106 mgl-1 and 0.051 mg.l-1 respectively(Fig.6). Pto 1 recorded the highest values of ammonia nitrogen in this study, obtaining in the month of March 2019 the highest concentration with 0.106mg.l-1 well above the average value of 0.047 mg.l-1). It should be noted that the results obtained at both sampling points in the five campaigns carried out in the study represented a small fraction of the total nitrogen.
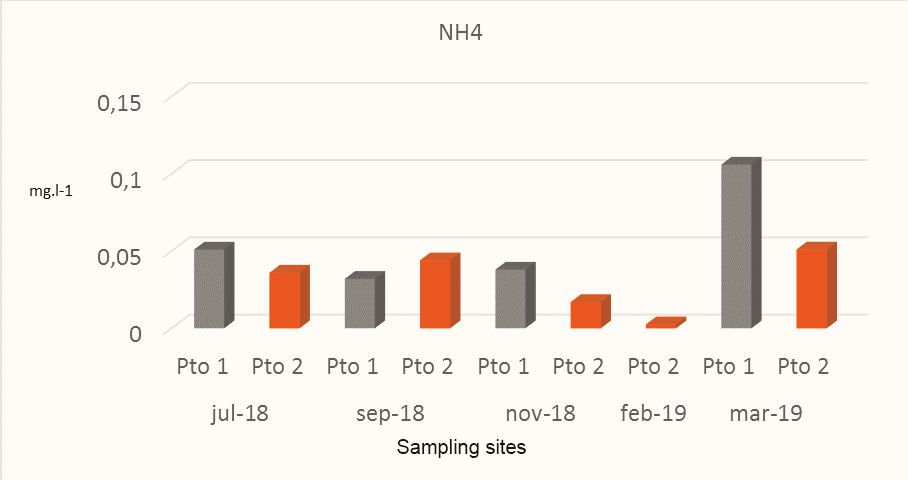
Figure 6.
Variations of the ammonia nitrogen obtained in the sites sampled in Miskitos Keys (Puerto Cabezas) in the dry and rainy season.
The presence of Ammonia Cal Nitrogen (N-NH3) in this study was lower than that found by CIMAB (2010) which reported higher values in most of the points sampled between 0.005 mg.l-1 and 0.142 mg.l-1. According to CIMAB (2010), ammonia nitrogen at pH greater than 8.0units is harmful to fish life; which did not occur during this monitoring. It is relevant to mention that the point sampled in 2019 presented values lower than 0.005 mg.l-1 in this study.
3.4.2 Phosphorus
Total Phosphorus
Total phosphorus (FT) is composed of the species of orthophosphates (soluble phosphorus), polyphosphates: pyrophosphates, tripolyphosphates and methosphates and organic phosphates. The FT in Pto 1 varied between less than 0.016 mg.l-1 to 0.182 mgl-1,while in Pto 2 it varied between less than 0.016 mg.l-1 to 0.123 mg.l-1 (Fig.7),obtaining in both muestreo points thehighest value in September 2018, with Pto 1 presenting the highest value, slightly higher than the average value obtained in this study with 0.117 mg.l-1.
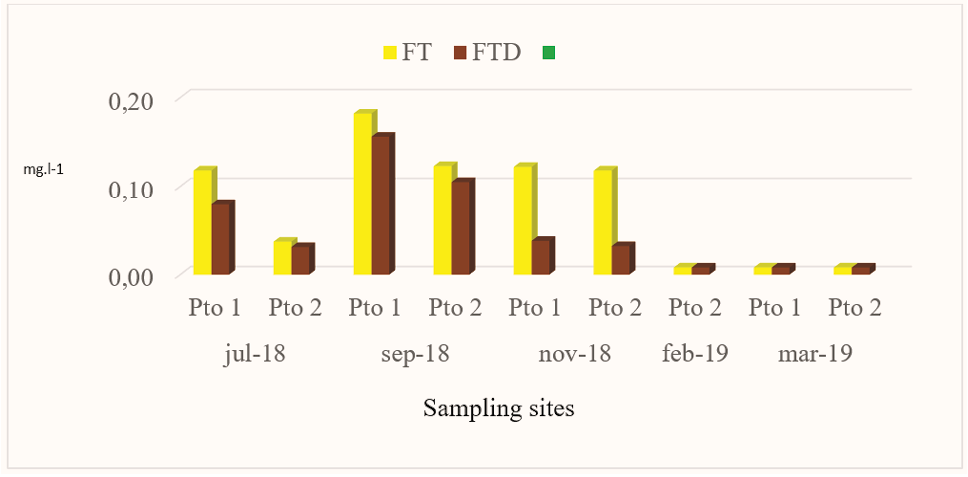
Figure 7.
Behavior of the FT and FTD obtained in the sites sampled in Miskitos Keys (Puerto Cabezas) in the dry and rainy season.
The presence of TP in the winter season is possibly due to the phenomenon of upwelling to the surface of deeper waters. The concentrations of TP in this research were similar in July 20 18, September 2018 and October 2018 to those found by CIMAB (2010),which reported values between 0.127 mg.l-1 and 0.146 mg.l-1. It is relevant to mention, that the points sampled in February 2019 and March 2019 presented values lower than 0.016 mg.l-1 in this study, possibly caused by a phytoplanktonic explosion. The “bloom” or period of phytoplankton explosion results in a decrease in phosphorus existing in the sea, since the intense consumption cannot be compensated by new contributions at the same speed (Cifuentes, Torres, & Frías, 1997). It should be noted that other contributions from TP in the study area in July 2019 and September 2019 possibly come from the remains of dead beings that are deposited in the bottom and on whose remains bacteria act, transforming them into inorganic elements.
Total Dissolved Phosphorus
TDP soluble species such as orthophosphate, polyphosphate and organic phosphorus, as well as colloidal species and polymers. The concentrations found of total dissolved phosphorus (TDP), showed a behavior similar to TP because the highest values were founding Sept-018,with Pto 1 presenting the highest value with 0.156 mg.l-1 (Fig.7),higher than the average value found in this study (0.074 mg.l-1).
The highest concentrations of TDP founding the winter season (July 2018 and September 2018) were possibly found by the influence of upwelling and due to updrafts these elements are put into circulation towards the upper layers causing the renewal of phosphates. It is in these areas that the conditions form to find the highest concentrations of TDP during the winter. According to (Cifuentes, Torres, & Frías, 1997), The circulation of water intervenes in the concentration of nutrients and they come back to the surface, by rising water currents, which occur when the temperature of the different bodies of water changes, in the so-called upwelling or upwelling zones. The behavior of the TDP is similar to that of the TP in the months of Feb-2019 and Mar-2019 because the concentrations found for both species are below 0.016 mg.l-1.
Dissolved Reactive Phosphorus
Dissolved reactive phosphorus (DRP) is a nutrient of great importance because it is used by plants, bacteria and algae. The FRD at both sampling points was found below the detection limit in all the months sampled (0.016 mg.l-1), which may be due to the need for it being recycled very quickly by aquatic microorganisms or the formation of complexes, chelates and insoluble salts with some metals that precipitate possibly because it is used by aquatic microorganisms in the process of photosynthesis decreasing its concentration. According to CCO (2013), phosphates are used by phytoplankton or plant plankton, in the processes of photosynthesis, which makes their concentration very variable, both horizontally and vertically. It is relevant to mention that the FRD as well as the TP and DRP were below 0.016 mg. l-1 in Pto 1 and Pto 2 in February 2019 and March 2019. Overall, the TN and TP concentrations found in this study are higher than those reported by the study previously conducted by (CIMAB, 2010).
4. CONCLUSIONS
The pH results are among the normal values for seawater, however, due to the methodology used in the analysis it is likely that there is an impact or CO2 emissions on the ramifications for ocean chemistry. The alkalinity is slightly above the values of seawater and reflect an alkaline trend, which relates to the pH values found in the water during this study. The variability of dissolved oxygen in Nicaragua’s Caribbean water is possibly due to the different physical, chemical and biological processes that occur in the sea continuously and that are dependent on temperature and salinity. The behavior of the nutrients shows that rising water currents intervene, which occur when the temperature of the different bodies of water in the areas called upwelling or upwelling change.
ACKNOWLEDGMENTS
The Fund for Research Projects (FRP), granted by the National Autonomous University of Nicaragua (UNAN-Managua), the Center for Research in Aquatic Resources of Nicaragua (CRAR/UNAN-Managua) for co-financing this research and the technicians of IREMADES-URACCAN for collaborating in the collection of water samples and supporting the transfer to CRAR/UNAN-Managua.
REFERENCES
APHA. (2012). Standard Methods for the Examination of Water and Wastewater. Washington.
Bradley, P., Sandersona, M., Frischer, M., Brofft, J., Booth, M., Kerkhof, L., & Bronka, D. (2010). Inorganic and organic nitrogen uptake by phytoplankton and heterotrophic bacteria in the stratified Mid-Atlantic Bight. Estuarine, Coastal and Shelf Science , 429-441.
Brierley, A., & Kingsford, M. (2009). Impacts of climate change on marine organisms and ecosystems . Current Biology.
Bustos, H. (2003). Manual of Laboratory Practices in Chemical Oceanography 2017-1. Mexico .
Caldeira, K., & Wickett, M. (2003). Anthropogenic carbon and ocean pH. Nature, 365.
BCC. (2013). The Ocean Earth Wonder. Bogota D.C: Colombian Ocean Commission.
Cifuentes, J., Torres, M., & Frías, M. (1997). The Ocean and its resources. II. The sciences of the Sea: geological oceanography and chemical oceanography. Mexico .
CIMAB. (2010). Monitoring program for the quality of marine ecosystems in high-risk areas in the Greater Caribbean region. "Regional Network in Marine Science and Technology for the Caribbean: Know-Why Network". Nicaragua .
Comeaux, R., Mead, A., & Bianchi, T. (2012). Mangrove expansion in the Gulf of Mexico With climate change: Implications for wetland health and resistance to rising sea levels. Estuarine, Coastal and Shelf Science, 81-95.
Crumpton, W., Isenhart, T., & Mitchell, P. (1982). Nitrate an Organic N analisis with second derivate spectroscopiy. Limnology & Oceanography .
Custodio, E., & Llamas, M. (2001). Underground Hydrology. Volume I and II. Barcelona, Spain : Omega, S. A.
De la Lanza Espino, G. (2001). Physico-chemical characteristics of the seas of Mexico. Mexico: Editores México.
Delvalls, A. (1999). Underway pH measurements in upwelling conditions: The California Current. Ciencias Marinas, 345-365.
Gomez, A. (1996). Causes of marine fertility in northeastern Venezuela. Interscience, 140-146.
Humbolt, C. (2008). Environmental monitoring of production systems. Nicaragua .
IPCC. (2013). Climate Change 2013: The Physical Science Basis. New York, USA.
Jennerjahn, T. (2012). Biogeochemical response of tropical coastal systems to present and past environmental change. Earth Science Reviews, 19-41.
Karl, D., & Michael, L. (2003). Nitrogen Cycle. Encyclopedia of Ocean Sciences, 1876-1884.
Khatiwala, S., Primeau, F., & Hall, T. (2009). Reconstruction of the history antrhropogenic CO2 concentration in the ocean . Nature .
Margalef, R. (1991). Limnology. Ecology . Barcelona : Ediciones Omega. S, A .
Marsh, G. (2005). Seawater pH and anthropogenic carbon dioxide. Chicago: Argonne National Laboratory .
Porzio, L., Buia, M., & Hall, J. (2011). Effects of ocean acidification on macroalgal communities. Journal of Experimental Marine Biology and Ecology, 278-287.
Ramírez, A., & Viña, G. (1998). Colombian Limnology contributions to your knowledge and statistical analysis. Colombia .
Waycott, M., Collier, C., McMahon, K., McKenzie, L., Udy, J., & Alana, G. (2007). Vulnerability of seagrasses in the Great Barrier Reef to climate change . Australia.