
ISSN 2410-5708 / e-ISSN 2313-7215
Year 11 | No. 31 | June - September 2022
© Copyright (2022). National Autonomous University of Nicaragua, Managua.
This document is under a Creative Commons
Attribution-NonCommercial-NoDerivs 4.0 International licence.

Quality and potential use of the waters of the Río Tipitapa
https://doi.org/10.5377/rtu.v11i31.14292
Submitted on August 9, 2021 / Accepted on May 4, 2022
Rommel Lacayo Morales
National Autonomous University of Nicaragua, Managua, Nicaragua
Nicaraguan Aquatic Resources Research Center (CIRA/UNAN-Managua)
Francisco J. Picado Pavón
National Autonomous University of Nicaragua, Managua, Nicaragua
Nicaraguan Aquatic Resources Research Center (CIRA/UNAN-Managua)
Section: Sciencies
Keywords: quality, water, Tipitapa, hydro chemistry
Abstract
Nicaragua is a privileged country for its aquatic resources, however, the pristine quality of these resources is threatened by various stressors. The Tipitapa River, located in the hydrographic basin UH 69-9529, is a natural drainage conduit of the waters of Lake Xolotlán towards Lake Cocibolca, which integrates the Tisma lagoon system considered as buffer zone between the upper and lower part of the river basin. This area receives and houses xenobiotics limiting their transport to the Cocibolca. Agricultural activity is predominant in the basin and this takes advantage of the waters of the Tipitapa River for the irrigation of crops such as rice, beans, wheat, legumes, as well as for the irrigation of grassland areas, among others. This research evaluates the physicochemical quality of the waters of the Tipitapa River and its suitability for irrigation of the crops of the area. To do this, two sites before and two sites after the Tisma lagoon were sampled twice, once in the rainy season and once in the dry season. The collected water samples were physically chemically analyzed. Field parameters were measured in situ at the time of sample collection. The results of the study reveal the current water quality of the waters of the Tipitapa River, as well as their availability for agricultural activity. This research contributes with scientific information for the establishment of plans in the management of water resources.
1. Introduction
The Tipitapa river is a water unit that until 1910 formed a fluvial connection between the Xolotlán and Cocibolca lagos, (IRENA, 1981) being possible the navigation of ships from San Francisco Libre to the Caribbean Sea. At present, the river is a natural flowing of Xolotlán lagoon and when the level of its waters exceeds 39.2 meters above sea level due to the occurrence of extreme climatic phenomena, such as Hurricane Mitch (1998) and Tropical Storm Agatha (2010), it joins the waters of both lakes. With Hurricane Mitch Lake Cocibolca received about 100 MMC of water from Lake Xolotlán (MARENA, 2001), which negatively affected the quality of its waters since the natural quality of the waters of the Xolotlán river has historically been affected by the anthropic pollution since 1927 when the discharge of wastewater from the capital began. From then until 1982 this body of water had received approximately 35.75 tons of organic matter (IRENA, 1981). Apart from this anthropic incidence, variability and climate change have affected the inter-lake zone, and since these stressors are linked to the rainfall or drought regime, it is necessary to establish consensual strategies for monitoring the area.
The Cocibolca lagoon is an important freshwater resource in Central America and is a potential source for fishing and recreational industry. At present, this lake is used as a source of drinking water for some coastal populations, and in the future it would supply larger cities such as Managua, Masaya and Rivas (World Bank, 2013). The Cocibolca basin is shared with Costa Rica and is made up of 20 surrounding sub-basins, including the Tisma sub-basin, where the Tipitapa river is located. This sub-basin is shared by the departments of Managua, Masaya and Granada, whose economic activities in some way affect the quality and chemical characteristics of the waters of the ecosystem. These incidents may be related to the transport of waste generated by agricultural activity to the river. Another type of incidence would be the weathering of the geological material of the area favored by the wind and water erosion, added to the particles of the soil eroded by the high tillage in the areas of crops with which they contribute, through the runoff, an important loading minerals and nutrients into the river, contributing to the eutrophication process.
This research also contributes with information to the Tisma Lagoon System RAMSAR site #1141; area highly threatened by the effect of population growth and anthropogenic activities. The objective of this research was to assess the water quality of the Tipitapa River and its possible relationship with anthropogenic incidents that affect the quality and use of its waters for crop irrigation.
2. METHODOLOGY
The research was carried out through the temporal analysis with the execution of two campaigns, one in the rainy season (October 2016) and another in the dry season (February 2017), for the collection of surface water samples from the Tipitapa River. Four sites were sampled along its 37.5 km river route (Figure 1). At the time of sample collection, some field parameters (pH, conductivity, temperature, etc.) were measured. The Tipitapa River is located in the hydrographic basin UH 69-952911 and 12 whose area is 557.96 km2, the average rainfall recorded is 1100 mm and the climate is characterized by warm temperatures throughout the year between 25.0 to 27.5°C (INETER, 2010); the coordinates of the sampled sites are: Site 1 (N: 1347636; E: 603499); Site 2 (N: 1343490; E: 607257); Site 3 (N: 1339863; E: 618095) and Site 4 (N: 1337989; E: 622507) (Figure 1).
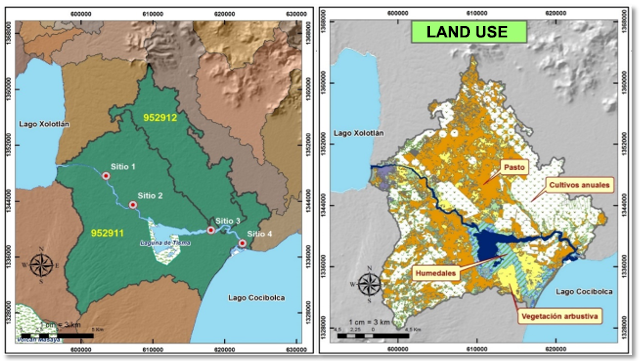
Figure 1. Sampled sites in the Tipitapa River basin (October 2016 and February 2017 and current land use of the inter lakes zone.
The quality of the collected water was examined through physicochemical analysis (CF), which included, turbidity pH, electrical conductiveness, color, concentrations of major ions such as sodium, potassium, magnesium, calcium, chlorides, sulfates, nitrates, carbonates, bicarbonates; inorganic constituents (hardness, alkalinity) and dissolved total solids. The analysis procedures used are those described in the Standard Methods of the Examination of Water and Wastewtwer. 22nd Edition (APAH, 2012); which are validated and supported by the analytical quality assurance and control system according to the ISO/17025 standard, implemented in the laboratories of CIRA/UNAN-Managua (https://cira.unan.edu.ni). To evaluate the quality results, the Canadian Water Quality Guidelines of the Canadian Council of Ministres of the Environment (CWQG/CCME, 2008) and Chapter 4 of Agricultural Uses and Environmental Regulations for the Classification of Water Resources defined in the item Waters Type 2 of Nicaragua were used as a reference (INAA, 1996). For the elaboration of maps and location of the sampled sites, ArcGis 10.2 software was used, while the hydrochemical classification of the waters was carried out using the Easy_Quim 3.0 program.
3. RESULTS
3.1.Field parameters
Table 1. Field parameters measured in the waters of the Tipitapa River in October 2016 and February 2017
|
Sampled sites |
October 2016 (Rainy season) |
February 2017 (Dry Season) |
||||
|
T (ºC) |
pH |
Conductivity (μS/cm) |
T (ºC) |
pH |
Conductivity (μS/cm) |
|
|
Site 1 |
32,40 |
8,89 |
419,0 |
28,50 |
8,08 |
696,0 |
|
Site 2 |
31,37 |
8,00 |
197,0 |
28,60 |
8,48 |
718,5 |
|
Site 3 |
31,37 |
8,08 |
442,0 |
31,20 |
8,16 |
540,0 |
|
Site 4 |
30,21 |
8,04 |
494,5 |
29,80 |
8,10 |
387,0 |
|
Average |
31,34 |
8,25 |
388,1 |
29,53 |
8,21 |
585,4 |
|
Deviation |
0,89 |
0,43 |
131,3 |
1,26 |
0,19 |
154,2 |
|
CV |
2,86 |
5,17 |
33,8 |
4,28 |
2,27 |
26,3 |
CV: Coefficient of Variation
3.2. Ionic imposition of waters
Table 2. Concentrations of cations and anions in the waters of the Tipitapa River, October 2016 and February 2017.
|
Sampled sites |
Cations |
Anions |
|||||||
|
Na+ |
Ca+2 |
K+ |
Mg+2 |
HCO3-2 |
Cl- |
SO4-2 |
CO3- |
NO3- |
|
|
October 2016 (Rainy season) |
|||||||||
|
Site 1 |
45,10 |
30,06 |
6,67 |
8,26 |
165,99 |
25,17 |
18,91 |
16,80 |
0,53 |
|
Site 2 |
19,00 |
14,43 |
9,34 |
3,40 |
100,00 |
10,13 |
7,72 |
2,00 |
< LD |
|
Site 3 |
54,00 |
22,44 |
11,34 |
10,69 |
202,59 |
31.08 |
19,46 |
2,00 |
< LD |
|
Site 4 |
67,70 |
21,64 |
11.18 |
11.18 |
222,11 |
38,25 |
18,15 |
14,4 |
< LD |
|
Average |
46,45 |
22,14 |
9,63 |
8,38 |
172,67 |
26,16 |
16,06 |
8,80 |
0,53 |
|
Deviation |
20,53 |
6,39 |
2,17 |
3,56 |
53,74 |
11,95 |
5,59 |
7,91 |
|
|
CV |
44,19 |
28,86 |
22,56 |
42,45 |
31,12 |
45,68 |
34,78 |
89,92 |
|
|
February 2017 (Dry Season) |
|||||||||
|
Site 1 |
83,95 |
44,89 |
15,80 |
12,64 |
338,05 |
45,94 |
18,60 |
< LD |
< LD |
|
Site 2 |
92,60 |
34,87 |
20,00 |
16,28 |
312,42 |
50,73 |
35,76 |
14,4 |
< LD |
|
Site 3 |
9,30 |
22,04 |
9,30 |
17,01 |
229,44 |
44,99 |
26,25 |
< LD |
< LD |
|
Site 4 |
6,10 |
22,04 |
6,10 |
11,18 |
163,53 |
30,63 |
15,58 |
< LD |
0,94 |
|
Average |
47,99 |
30,96 |
12,8 |
14,28 |
260,86 |
43,07 |
24,05 |
14,40 |
0,94 |
|
Deviation |
46,67 |
11,08 |
6,27 |
2,81 |
79,74 |
8,67 |
9,01 |
||
|
CV |
97,26 |
35,80 |
48,99 |
19,71 |
30,57 |
20,12 |
37,46 |
||
< LD: Less than the Detection Limit of the method.; CV: Coefficient of Variation
3.3. Total Hardness (DT) and Total Alkalinity (AT)
The average DT value at the sampled sites indicates that the waters of the Tipitapa River are moderately hard. In sitio 4, an average concentration of 100.50 (± 0.71) mg/l was observed; CV=0.70 %, however, in site 1 the highest mean concentration was observed at 136.50 (± 38.89) mg/l; CV=28.49%.
The TA of the waters of the Tipitapa River is dominated by the bicarbonate ion (HCO3-2) with pH values ranging from 8.00 to 8.89 Unds. Between October 2016 and February 2017, the range of observed VALUES of AT was from 81.95 to 280.05 mg/l, with sites 1 and 2 where the greatest differences between sampling are observed. The highest observed mean ta value was on site 1 with a value of 220.55 (± 79.90) mg HCO3-2/l; CV = 36.23% and lowest in site 4 with 158.00 (± 33.94) mg HCO3-2/l; CV = 21.48%).
3.4. Hydrochemistry of the Tipitapa River
Table 3. Hydrochemical composition of the waters of the Tipitapa River, October 2016 and February 2017.
|
Sampled sites |
Hydrochemical (meq/l) |
Total Dissolved Solids (mg/l) |
Electrical conductivity (dS/m) |
Sodium Adsorption Ratio (RAS) |
|||
|
Sodio (Na+) |
Magnesium (Mg+2) |
Calcium (Ca+2) |
Bicarbonate (HCO3-2) |
||||
|
October 2016 (Rainy season) |
|||||||
|
Site 1 |
1,926 |
0,680 |
1,500 |
2,721 |
269,80 |
0,419 |
1,845 |
|
Site 2 |
0,827 |
0,280 |
0,720 |
1,639 |
145,46 |
0,197 |
1,170 |
|
Site 3 |
2,349 |
0,880 |
1,120 |
3,320 |
289,71 |
0,442 |
2,349 |
|
Site 4 |
2,946 |
0,920 |
1,800 |
3,640 |
314,23 |
0,495 |
2,526 |
|
Average |
2,010 |
0,690 |
1,290 |
2,830 |
254,80 |
0,370 |
1,970 |
|
Deviation |
0,894 |
0,293 |
0,468 |
0,881 |
75,12 |
0,150 |
0,608 |
|
CV |
44,430 |
42,440 |
36,440 |
31,120 |
29,48 |
41,810 |
30,820 |
|
February 2017 (Dry season) |
|||||||
|
Site 1 |
3,652 |
1,040 |
2,240 |
5,541 |
435,65 |
0,696 |
2,852 |
|
Site 2 |
4,028 |
1,340 |
1,740 |
5,121 |
447,16 |
0,719 |
3,246 |
|
Site 3 |
2,971 |
1,400 |
1,100 |
3,761 |
316,62 |
0,540 |
2,657 |
|
Site 4 |
1,844 |
0,920 |
1,100 |
2,680 |
215,42 |
0,387 |
1,835 |
|
Average |
3,120 |
1,180 |
1,550 |
4,280 |
353,71 |
0,590 |
2,650 |
|
Deviation |
0,959 |
0,232 |
0,553 |
1,307 |
109,46 |
0,154 |
0,594 |
|
CV |
30,690 |
19,720 |
35,79 |
30,570 |
30,95 |
26,370 |
22,450 |
CV: Coefficient of Variation
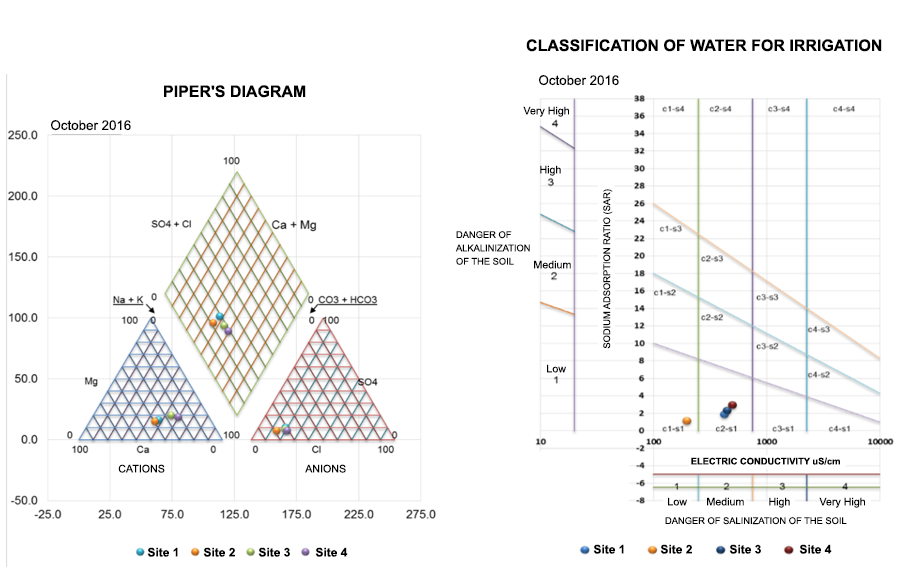
Figure 2. Hydrochemical and quality for irrigation of the waters of the Tipitapa river. October 2016 (Rainy season).
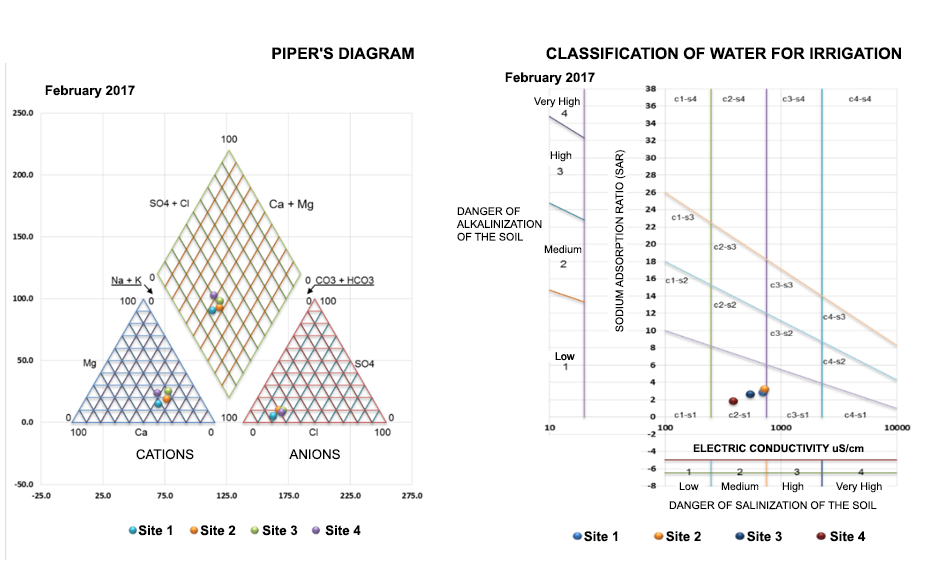
Figure 3. Hydrochemical and calidad for irrigation of the waters of the Tipitapa river. Febrero 2017 (Dry season).
4. DISCUSSION
4.1. pH of the waters of the Tipitapa River
The variability in the pH values of the waters, along the Tipitapa river, is marked by the pH of the waters of site 1 observed eventually in October 2016. On the other hand, in mid-February 2017, the pH value of site 2 was the one that contributed to this variation (table 1). The maximum observed pH values are due to relatively high concentrations of carbonate ions (CO3-) and bicarbonates (HCO3-2) (Table 2) and consequently to the high values in alkalinity. This last ion (HCO3-2) has a longitudinal domain over the concentrations of the rest of the component ions (Tables 2 and 3) of the hydrochemistry of the waters of the Tipitapa river. The pH values observed in this research are similar to those reported by previous studies (CIRA, 2011) and do not imply negative effects for the river biota according to the range of guide values for the protection of aquatic life (6.5 - 9.0 Unds of pH) (CWQG/CCME, 2008), as well as, do not limit the use of these waters for irrigation. However, monitoring this variable in the river is of paramount importance, given that high pH values in conjunction with other environmental factors, such as light, low water velocity and high nutrient availability in the Tipitapa River, could favor the development of cyanobacteria (blue-green algae) that alter water quality (ACUMAR, 2009). On the other hand, low pH valores cause damage to the gills of some fish; the damage threshold for the case of ichthyospecies tolerant to acidic pH is between 5.2 to 5.6 (ACUMAR, 2009)
4.2. Electrical Conductivity (EC) and Total Dissolved Solids (STD)
As in other lotic ecosystems, the electrical conductivity of the waters of the Tipitapa river (Figure 5) has a linear dependence (EC= -56.787 + 1.746 x STD, r2= 0.9985, October 2016; CE= 87.267 + 1.4082 x STD r2= 0.9988, February 2017) with dissolved solids which are ionized chemical elements, mainly mineral salts, which are found naturally or by anthropic incidence. In most freshwater bodies the values of this variable range from 10 to 1000 μS/cm however, in contaminated water these values increase. Historically, the EC values of the waters of the Tipitapa River have varied from 539.0 to 1327.0 μS/cm (Rueda Hernández, 2006); (CIRA, 2011) however, the values measured in this research correspond to a minimum of 197.0 and a maximum of 718.5 μS/cm (Table 1), both observed on site 2 in October 2016 and in February 2016. 2017 respectively. These observations show the effect of dilution and/or reconcentration of salts. The historical data and concentrations quantified in this research reveal that the waters of the Tipitapa River are mineralized waters. According to Roldán (2008),the EC values for this type of water should be between 500 and 2000 μS/cm. When comparing these values with the values eventually observed in October 2016 and February 2017 (Table 1), some of them are within the range; in general, for rainy season it is less and in dry season they are slightly inside it.
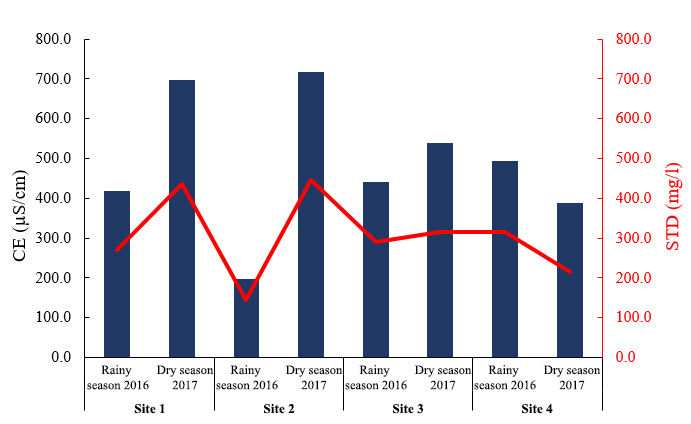
Figure 5. Behavior of the Electrical Conductivity (EC) and Concentration of Total Dissolved Solids (STD) in the waters of the Tipitapa River, October 2016 (Rainy season) and February 2017 (Dry season).
The spatial and temporal behaviour of stDs and ec in the waters of the Tipitapa river have a similar pattern (Figure 5). The high values of both variables could be due to the loss of the volume of water by evaporation and the lower values would be related to the dilution by the rains of the minerals present. However, this dilution masks the influence on the chemical composition of the waters of the mineral charge caused by the local weathering of the geological material. Historical findings reveal changes in STDs in river waters ranging from 341.02 to 803.04 mg/l(Rueda Hernández, 2006); (CIRA, 2011). In this research it was observed that the concentrations of stDs (Figure 5) are lower than the environmental regulations of INAA (1996), which considers a maximum permissible limit of 3000 mg/l for these ecosystems.
4.3. Cations and Anions
The dissolution of cations and anions (Figure 6 and 7) in the waters of the Tipitapa River is evident in the rain period, while in the summer period the reconcentration of the same products of the loss of the volume of water by evaporation is observed.
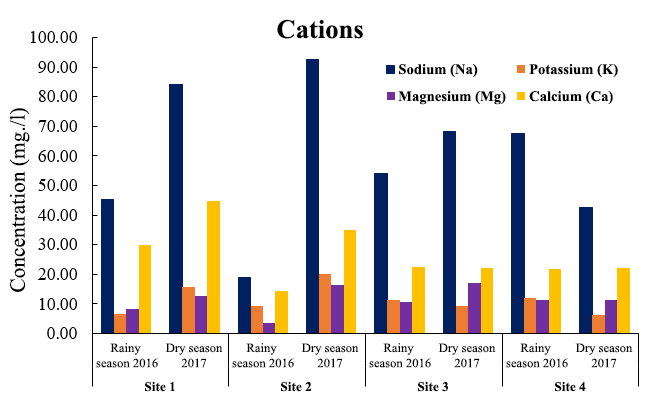
Figure 6. Concentrations of macro cations of the waters of the Tipitapa River observed in October 2016 (Rainy season) and February 2017 (Dry season).
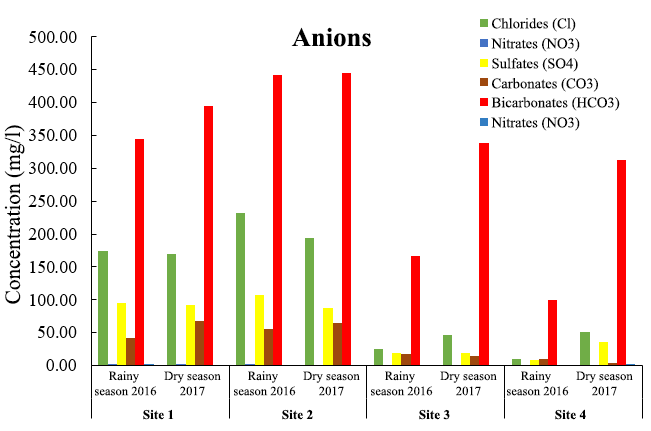
Figure 7. Concentrations of macro anions in the waters of the Tipitapa river observed in October 2016 (Rainy season) and February 2017 (Dry season).
The behavior of chemical pollutants in natural waters is dependent on the hydraulic conditions, environmental conditions and the physicochemical properties that predominate in them. The presence of dissolved CO2 and its ionized species such as HCO3- and CO3-2 in waters, influence the balances of precipitation and dissolution of inorganic compounds (Barceló, et al., 2002). The concentrations of macro-ions in most surface waters in the world tend to exist in the following proportions: Ca+2 > Mg+2 ≥ Na+ > K+ and CO3-2 or HCO3- > SO4-2 > Cl- ; by the Chebotarev sequence the calcium ions and bicarbonates are the predominant ones and confer the chemical character to the water (Padilla & Garcia, 2012). The results of this research show that tipitapa water has a distribution of ions according to their concentrations in the following order: Na+ > Ca+2 > K+ > Mg+2 for cations and in relation to the anions the order is: HCO3- > Cl- > SO4-2 > CO3-2, with low concentrations of NO3-, possibly related by anthropic action (Table 2). According to these observations, the waters are classified as bicarbonate-sodium-calcium, water of mixed characteristics possibly influenced by the geologic composition of the area, such as the predominant quaternary formations (INETER & OIEA, 2011) and its weathering produced by precipitation (1,200 - 1,400 mm) which are irregular in their interannual distribution as a result of climate variability (Castle, 2018).
4.4. Total Hardness (DT) and Total Alkalinity (AT).
The DT of the waters is classified according to the concentration of coltium carbonate (CaCO3) present as defined in, soft waters (<75 mg CaCO3/l), moderately hard waters (75 - 150 mg CaCO3/l), hard waters (150 - 300 mg/l) and very hard waters (>300 mg CaCO3 (l) (Roldán P. & Ramírez R., 2008). Therefore, according to this classification, the waters of the Tipitapa River are waters with moderate hardness (Table 4).
Table 4. Average values of Total Hardness (DT) and Total Alkalinity (TA) of the waters of the Tipitapa River
|
Sampled sites |
Concentration (CaCO3) (mg/l) |
Reference value (mg/l) |
||||
|
GERMAN |
AT |
GERMAN |
AT |
|||
|
Oct 2016 |
Feb 2017 |
Oct 2016 |
Feb 2017 |
Moderately hard waters: 75-150 mg/l (Roldán, 2008) |
< 75 (Low) 75 – 150 (Medium) > 150 (High) (Kevern, 1989) |
|
|
Site 1 |
109,00 |
164,00 |
164,05 |
277,05 |
||
|
Site 2 |
50,00 |
154,00 |
81,95 |
280,05 |
||
|
Site 3 |
100,00 |
125,00 |
166,00 |
188,05 |
||
|
Site 4 |
100,00 |
101,00 |
182,00 |
134,00 |
||
The values of total alkalinity presented a temporal and spatially heterogeneous behavior (CVmin: 21.48; Vmax 36.23). It observed a decrease in CaCO3 concentrations of the waters of the river in sites 3 and 4 (Figure 6) located after the Tisma lagunar system, evidencing the buffering capacity of the wetland.
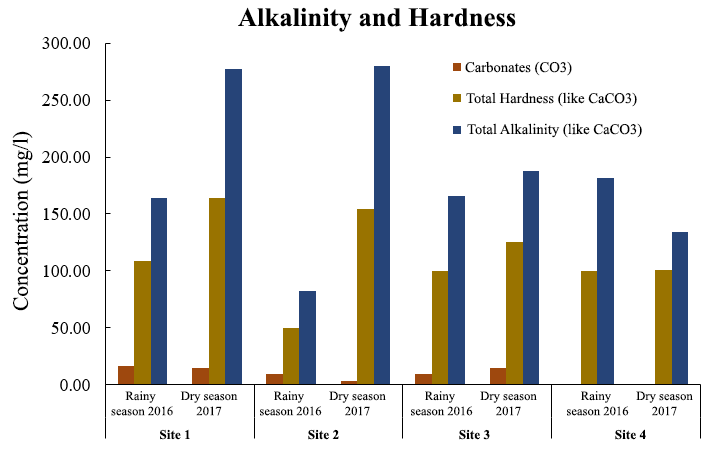
Figure 8. Behavior of the Alkalinity and Total Hardness in the waters of the Tipitapa River observed in October 2016 (Rainy Season) and February 2017 (Dry Season).
When comparing the concentrations of the total Alkalinity with the established ranges (tabla 5) we can affirm that the waters of the Tipitapa river have a high alkalinity, which gives it a basic pH and a characteristic CE of mineralized waters.
4.5. Hydrochemistry
The hydrochemistry of the waters (figures 2 and 3) of the Tipitapa River is bicarbonate-sodium (HCO3-Na) in sites 1, 2 and 3, according to samples collected in October 2016, while in site 4, near Lake Cocibolca, it is bicarbonated. Calcium-Magnesic (HCO3-Ca-Mg), which is very similar to the waters of Lake Cocibolca(Zamorio A., 2018), thus reaffirming the high presence of the HCO3- ion in the waters of the inter-lake area. The hydrochemical character of the waters of sites 1, 2 and 3 may be linked to waters that may come from Lake Xolotlán or regional discharge waters, mature groundwater from the Las Sierras aquifer. Other studies report the hydrochemistry of the Tipitapa River and the Tisma Lagoon (Zamorio A., 2018) as HCO3-Na with a tendency to Cl-. The hydrochemical nature of both bodies of water shows that Lake Xolotlán significantly feeds the flow of the river. The waters of site 4, due to its proximity to Lake Cocibolca, could have incidences of the waters of the lake since it shows an HCO3-Ca-Na type (Zamorio A., 2018). As we can see, the mineralization in the waters of the Tipitapa River has a composition dominated by the presence of cations such as Na+, Ca+2 and Mg+2 and the HCO3- anion. Despite the presence of these ions, these waters are classified as low hazard in relation to soil alkalization and from low to medium with respect to salinization. When analyzing the classification diagram of the water for irrigation (figuras 2 and 3) these are aptas for irrigation in most of the crops in the area such as, rice, cane, beans, corn, legumes, etc.
By February 2017, the hydrochemistry of the waters did not change presenting bicarbonate-sodium conditions (HCO3-Na) in sites 1, 2 and 3, while site 4 its characteristic was bicarbonates-calcium-magnesic (HCO3-Ca-Mg) (figura 2), classifying them as medium salinity water, suitable for irrigation of salinity tolerant crops and low Na+ content, placing them in water for irrigation in most crops (figura 8).
The chemical characteristics of the water used for irrigation are influenced by the salt content in the water, being reflected in parameters such as the CE/STD ratio (Electrical Conductivity /Total Dissolved Solids), RAS (Sodium Adsorption Ratio), the alcalinity, the impurity and pH of the water. None of the ranges of the parameters evaluated presented values that were considered anomalous or that indicate that the waters of the Tipitapa river are not suitable for the irrigation of crops in its basin. The quality of some water sources can vary significantly according to the time of year (rainy or dry) therefore, monitoring water quality on a higher resolution scale throughout the year could reflect changes in ecosystem hydrochemistry due to the environmental environment.
5. CONCLUSIONS
The hydrochemical nature of the waters of the Tipitapa River is currently not influenced by anthropic activities and indicates that so far its mineralization status does not confer a danger of RAS to its waters.
According to the evaluation references consulted, the physical and chemical characteristics of the waters of the Tipitapa River currently infer quality for irrigation.
6. THANKS
To the National Autonomous University of Nicaragua (UNAN-Managua) and Vice Rectorate for Research, for the support provided through the Research Funds (RF).
To the Center for Research in Aquatic Resources of Nicaragua through the Regional Project RLA 7/019 “Development of indicators to determine the effect of pesticides, heavy metals and emerging pollutants on inland aquatic ecosystems important for agriculture and the agricultural industry” (ARCAL CXXXIX).
Bibliography
ACUMAR. (April 2009). Criteria used for the definition of the values associated with each area of use. http://www.acumar.gov.ar/ACUsentencias/ndoza/2009abril/060409e/AnexoIIusos060409.pdf
APAH. (2012). American Public Health Association (APAH). Standard Methods for the Examination or Waters and Wastewater. 22 ed. APHA.
World Bank. (November 5, 2013). Policy and Investment Priorities to Reduce Environmental Degradation in the Lake Nicaragua Basin (Cocibolca). The Main Environmental Challenges. www.worldbank.org/lac.
Barceló, I., Allende, I., Solís, H., Bussy, A.-L., & González, C. (2002). Determination of the state of equilibrium of a water system. Journal of the Chemical Society of Mexico, 46(2), 93-104.
Castillo, F. (2018). Evaluation of the environmental quality of the Wetland Wildlife Refuge Lagoon System of Tísma, Masaya, Nicaragua. Managua: FACULTY OF NATURAL RESOURCES AND THE ENVIRONMENT (UNA).
CIRA. (2011). Evaluation of the Impact of the Water Quality of Lake Xolotlán on the Tipitapa River and the immediate area in Lake Cocibolca (Rainy Season, December 2010 and Dry Season, April 2011. CIRA/UNAN-Managua.
CWQG/CCME. (2008). Canadian Water Quality Guidelines . Toronto: Canadian Council of Ministers of the Environment .
INAA. (1996). Ambiemtal Regulations for the Classification of Water Resources. : Government of Nicaragua.
INETER. (2010). Identification and assessment of hydrological flows between the lakes of Managua and Nicaragua, Applying Nuclear Techniques for the Development of a Management Plan for the Watershed of the Great Lakes. Managua: Name of OIEA - Experto Hidrogeólogo, Sergio Iriarte Díaz .
INETER, & IAEA. (2011). Hydrogeological and isotopic characterization of the Tipitapa-Malacatoya aquifer in the interlake strait area. IAEA & INETER Project.
IRENA. (1981). Groundwater in the area of Tipitapa-Las Banderas-San Juan-San Isidro. Nicaraguan Institute of Natural Resources and the Environment (IRENA).
Kevern, R. (1989). Alkalinity water, classification systems. volume Part 1. Michigan: The Michigan.
MARENA. (2001). Report on the Environmental Status in Nicaragua. Ministry of Environment and Natural Resources (MARENA).
Padilla, T. A., & García, N. (2012). Hydrochemistry of surface water from the Sub-basin of the Quiscab River, Agricultural Technical Sciences, 17-20.
Roldán P., G., & Ramírez R., J. J. (2008). Fundamentals of Neotropical Limnology. University of Antioquia.
Rueda Hernández, M. (2006). Behavior of the physicochemical and microbiological conditions of the Tisma Lagoon in 2000 and 2005. (UNAN-Managua, Ed.) University and Sciences, 2(3).
Zamorio A., M. J. (2018). Evaluation of the migration of pollutants from Lake Xolotlán to Lake Cocibolca. CIRA.