
ISSN 2410-5708 / e-ISSN 2313-7215
Year 9 | No. 25 | p. 227 - 245 | June - September 2020
© Copyright (2020). National Autonomous University of Nicaragua, Managua.
This document is under a Creative Commons
Attribution-NonCommercial-NoDerivs 4.0 International licence.

Dynamics of land cover in Sub-basin III of the South Basin of Lake Managua, Nicaragua
https://doi.org/10.5377/torreon.v9i25.9857
Submitted on January 27, 2020 / Accepted on March 21, 2020
MSc. Ingrid Ubeda Trujillo
Researcher and full professor of the Geography department
National Autonomous University of Nicaragua, Managua
Ph.D. Lester Rocha
Researcher and full professor of the Zootechnics Department
National Agrarian University, UNA
Keywords: change of land cover, Markov Chains, logistic regression, orderly allocation method.
SUMMARY
Sub-basin III of the South Basin of Lake Managua, Nicaragua (hereafter Sub-basin III of Managua) is considered a strategic area for the economic and social development of Managua, so the dynamics of land cover that occur there generate environmental conflicts of different magnitudes. Therefore, the novelty of the study is the evaluation of the dynamics through Markovian transition probabilities using Landsat satellite images. Furthermore, based on logistic regression models, the biophysical and socioeconomic variables that affect the transitions of each land cover occurred over time were determined. And additionally, with the Orderly Allocation method plus the previous procedures, the dynamics of each coverage was simulated to the year 2025. The predictive capacity of the logistic regression models was evaluated by the method of the ROC curve (Receiver Operating Characteristic). The following periods were considered: 1997-2003, 2003-2010, 2010-2016, 2016-2025 (simulated). The results indicated that in the study area during all the periods, agriculture predominated with few oscillations over time. For the simulated period, there are high probabilities that the forest and urban areas will increase. The estimated transitions during the different periods observed reflect a high dynamism between the land covers. During the simulation, and with few exceptions, a similar dynamism was observed concerning the last observed period. Biophysical and socioeconomic variables explain the land cover transitions in Sub-basin III of Managua. However, the influence and the direction changes of the effects were not constant in the evaluated periods. Additionally, the validation results indicate that the land cover change model was acceptable.
INTRODUCTION
Agriculture and urbanization are the main engines in the dynamics of land cover, having a significant effect on the world’s landscape, and causing a greater environmental change in the biosphere (Lambin, Geist and Lepers, 2003; Lambin and Geist, 2006; Lambin, EF, Meyfroidt, P., Rueda, X., Blackman, A., Borner, J., Cerutti, PO, Wunder, S, 2014; Han, Yan and Song, 2015). Research into the modeling of land cover dynamics has focused on employing analytical methods of the stochastic process, logically and spatially explicit regression models, for the evaluation of factors and variables that determine changes in land cover, and in turn facilitate exploring their future demand (Veldkamp and Lambin, 2001; Overmars, by Koning Veldkamp, 2003; Lambin and Geist, 2006; Verburg, Rousenvell and Veldkamp, 2006; Zhu, Liu, Chen, Zhang and Verburg, 2010; Fuchs, Herold, Verburg and Clevers, 2013; Molds, Buytaert and Mijic, 2015; Pazúr, Otahel, and Maretta, 2015; Han, Yan and Song, 2015).
The transition from one land cover to other covers is influenced by direct and indirect causes (Lambin et al., 2003; Lambin and Geist, 2006). These causes are different for different regions and scales (Lambin et al 2003; Zhu et al., 2010). At the local level, the three variables that influence the transition are socioeconomic, geophysical, and accessibility (Veldkamp and Lambin, 2001; Molds et al., 2015; Han, et al., 2015).
The socio-economic variable leads to agricultural expansion, the construction of new roads and new settlements for the rural population (Rudel, TK, Schneider, M., Uriarte, BL, Turner, DR, Lawrence, D., Geoghegan, J., and Grau, R, 2009). The geophysical variable establishes that the slope and altitude determine the loss of mixed forest to open agricultural spaces (Pineda, Bosque, Gómez, and Plata, 2011).
The variable related to accessibility makes it easier to consider the original theory of the location where the centers of influence separate the various areas of use according to the costs of displacement and based on factors such as river channels, soil fertility, and their production, transport, and distribution, population centers, market production as documented by Von Thunen (1826, cited in Alarcón, 2006). In the case of a basin, if it has access to underground resources, accessibility measured in Euclidean distances, the coverage of the assigned land will be agricultural (Henríquez, Azócar, and Aguayo, 2006), leading to the expansion of the agricultural frontier, and conditioned to in turn for road infrastructure, human settlements, and forest loss (Pineda et al., 2011). Shrub covers gradually reduce their distance to cities due to agricultural abandonment, leading to crops being at an average distance from the population nucleus (Peña, 2007). On the other hand, the vegetation cover is totally reduced, giving rise to agricultural, residential or industrial activities (Gong, Juquuan, and Shixiao, 2011; Han, et al., 2015). The selection of variables that determine the changes will often depend on the availability of the data (Lambin, EF, Turner, BL, Helmu, J., Geist, HJ, Agbola, SB, Angelsen, A., Xu, J, 2001).
Urban coverage, open and closed forest in Managua Sub-basin III increased by 0.98% and 24.45% during 2000 and 2007 due to forest management and the approval of housing projects (ALMA, 2008). Despite this information, very little is known about the dynamics of land cover over time and the driving forces that could explain the changes. Therefore, this study aims to evaluate the dynamics of land cover in Sub-basin III of Managua, in the period from 1997 to 2016, and project the dynamics to the year 2025, determine the variables that affect the dynamics, and evaluate the model that determines land cover dynamics both statistically and spatially.
METHODOLOGY
Study area
Sub-basin III of Managua is located in the South Basin of Managua, Nicaragua (Figure 1). It has an area of 17, 337 ha, and the municipalities that are part of the study area are El Crucero, La Concepción, Ticuantepe, Nindirí, and districts V and VI of Managua. Managua Sub-basin III extends from the shores of Lake Managua, coinciding with the lower part of the study area (north on the map), to the El Crucero Plateau, coinciding with the upper part (south on the map).
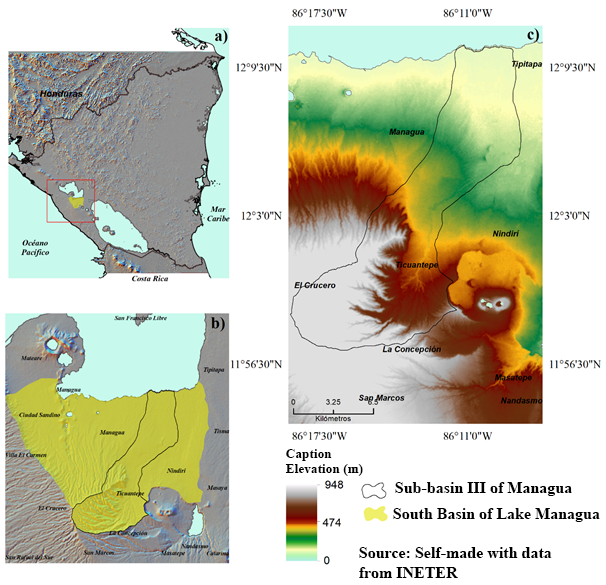
Figure 1. Location of the study area, a) Map of Nicaragua, b) Map of the South Basin of Lake Managua, c) Map of Sub-basin III of Managua. Source: Self-made with data from INETER
The total population located in Sub-basin III of Managua is approximately 1,048,424 (INIDE, 2005). The municipality of Managua (District V and VI) contributes 79.2% of the population, Ticuantepe 10.5%, Nindirí 6.5%, La Concepción 1.9% and Crucero 1.9% (ALMA, 2008).
The Managua Sub-basin III presents precipitation between 1700 mm/year and 800 mm/year. It is characterized by altitudes between 0 to 948 meters above sea level, with slopes ranging from 0° to 49°, from steep relief to flat to slightly wavy relief. It also presents two life zones, Premontane Subtropical Humid and Tropical Dry Forest (ALMA, 2008).
Managua Sub-basin III is a strategic area for the economic and social development of Managua. In the lower part of the area under study are national, industrial and commercial infrastructures, as well as settlements, residential and neighborhoods (ALMA, 2008).
METHODS
Land covers
From Landsat 7 and 8 satellite images (ETM + sensor) downloaded from the United States Geological Survey (USGS), they were interpreted following the Interdependent Classification method (FAO, 1996), and segmented, based on the definition of the Landcover categories: water, forest, urban, agriculture, and scrub.
Additionally, a quality check of the processes used was performed, superimposing the cartography of land cover provided by the Nicaraguan Institute for Territorial Studies (INETER as in Spanish), high-resolution satellite images (Google Earth portal, reconnaissance work in the field, and prior knowledge of the area under study.
Considering the previously defined land cover categories and the number of resulting polygons on the map, 32 control points (reference pixels) randomly distributed with a radius of 100 m were used. These control points were validated on-site and based on the classified satellite image. Confidence evaluation was performed using a confusion matrix (Chuvieco, 2010) obtaining an overall map accuracy of 81.25%. Next, the maps showing the land cover categories for the years 1997, 2003, 2010, and 2016 were prepared.
Modeling of land cover dynamics
The dynamics of land cover were evaluated with the Markov Chain, logistic regression, and Orderly Allocation methods (Molds et al., 2015). For this, the transition probabilities of land cover and the variables associated with the change of said land cover were determined.
Based on the maps showing the land cover categories, the probability of status category change was quantified for each transition (1997-2003, 2003-2010, 2010-2016, 2016-2025) and using “Markov chains”, which is a stochastic process that satisfies the Markovian property:
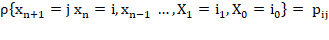
For all states i0, i1, ... ... ., in-1, i,j and all the n ≥ 0
The above can be interpreted as the conditional distribution of any future state Xn+1 given the past states X0, X1 … … ., Xn-1 y and the present state is independent of the past states and depends only on the present state. Since the probabilities are positive, we have:


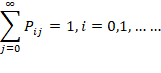
The transition probabilities were arranged in a state probability matrix, in which the diagonal represents the stability of the system and the values close to 1 represent the no change. The values outside the diagonal indicate the dynamics of change, values close to 1 represent greater dynamism.
Variables associated with the change of land cover
To determine the variables that explain the change in land cover for each period evaluated, it was considered that each cover was modeled independently with the spatially explicit variables, applying a logistic regression model.
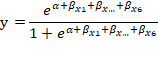
X1 … … X6 Explanatory Variables.
β1 ….. β6 Regression parameters.
The explanatory spatial variables for modeling land cover changes were: a) Height, b) distance to roads. c) distance to the city, d) distance to the drainage network, e) slope of the terrain in degrees, and f) previous land cover. In all cases, the complete model consisted of the main effects of the adjustment.
After fitting the entire model, the non-significant terms were removed step by step until the minimum suitable model was found. Using the results of the models, an adequacy map was generated that shows the spatial location probabilities of each land cover as a function of each of the explanatory variables (Molds et al., 2015).
The spatial location of the transitions of each land cover was performed using the Ordered Stochastic Allocation method using the influence of the explanatory variables. This method spatially and hierarchically assigned the distribution of the transitions of each coverage creating a matrix of requests (areas of land cover) for each year evaluated and for each coverage.
Future dynamics of land cover by 2025
The land cover dynamics to the year 2025 was modeled based on the stochastic transitions of each land cover for each evaluated period and based on the spatially explicit variables that explain each transition, and which generated the suitability map for each coverage (Molds et al., 2015).
Evaluation and validation of the land cover dynamics model
To evaluate the results derived from the logistic regression model, and mitigating the problem associated with the spatial autocorrelation that the regression models generate (Verburg, Soepboer, Veldkamp, Limpiada, and Mastura, 2002; Molds et al., 2015), stratified random samples of pixels were used, and the data were divided into two groups: data for training and data for testing.
Training data was used to create the regression models, instead, test data was used to evaluate the models. The ROC curve method was used to evaluate the predictive capacity of the models. This method indicates that if the AUC (Area under the curve) equals 1, the fit is perfect, and if the AUC equals 0.5, the fit is purely random (Molds et al., 2015). The validation of the spatial distribution of the transition of each cover was performed by comparing the simulated map of the land cover of 2010 and the map obtained for the same year (Pontius, Peethambaram, & Castella, 2011).
Analysis of the information
The evaluation of land cover dynamics was performed with the Land Use Change Modeling package (Molds et al., 2015) of the R software (R Core Team, 2018).
RESULTS AND DISCUSSION
Land cover during the period 1997-2025
Figures 2 and 3 show the land cover: water, forest, agriculture, urban and scrub for the years 1997, 2003, 2010, 2016, and 2025 (simulated). During the periods under study, it is observed that the agricultural coverage predominates in the area of Sub-basin III with few oscillations during the time, unlike the forest and scrub cover. On the other hand, an increasing trend of urban coverage is observed over the years.
In the period 1997-2016, forest and agriculture coverage decreased by 10% and 0.7%, respectively, however, an increase was observed in scrub (1.4%) and urban (9.5%) coverage. Compared to the 2016-2025 period, an increase in forest and urban coverage is expected by 9% and 2.5%. Conversely, agriculture and scrub coverage will decrease by 3.6% and 7.8%. Although the future simulation indicates the decrease in agricultural cover and the increase in forest cover, the abandonment of agricultural land cannot be assumed without the intervention of an explicit policy (Rudel, et al., 2009), however, as the farmers abandon the least productive fields, a probable forest transition is generated with forests that extend along abandoned lands (Satake and Rudel, 2007).
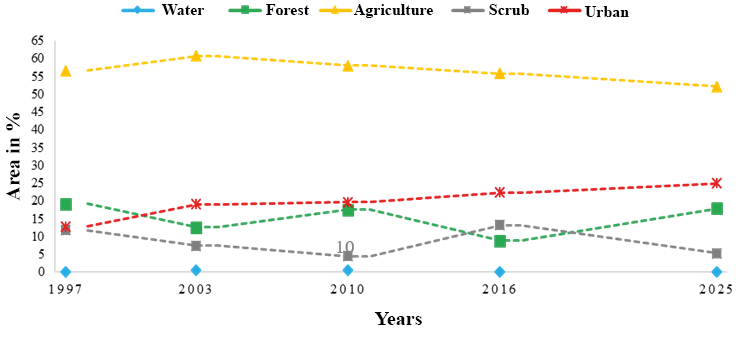
Figure 2. Annual trends in land cover in Managua Sub-basin III for the years under study. Source: self-made
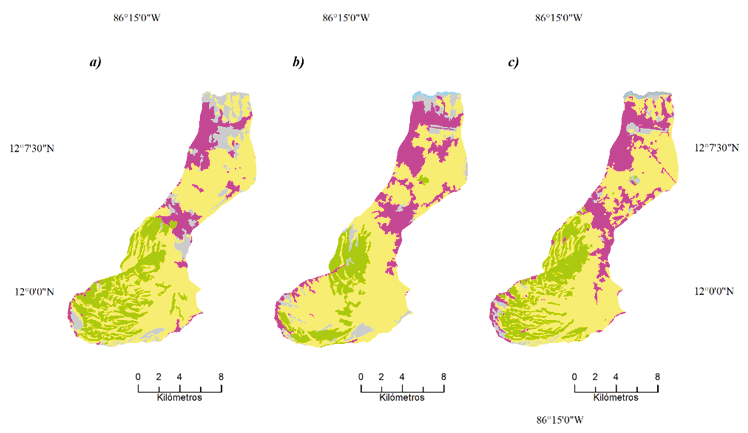
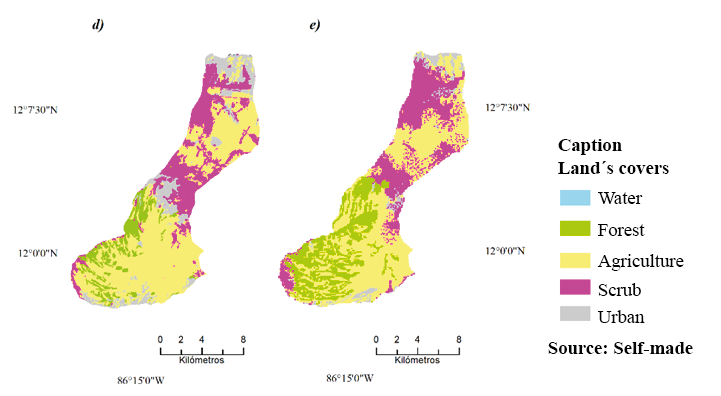
Figure 3. Land cover in Managua Sub-basin III for the years under study: a) 1997, b) 2003, c) 2010, d) 2016, e) 2025
Dynamics of land cover in Managua Sub-basin III in the period 1997-2025
The transitions during 1997-2003 indicate that the land cover categories were very dynamic, with water, agriculture and urban being the ones that presented the greatest stability in the period. The transitions found with greater probabilities of change were from the forest and scrub to agriculture, and from scrub to urban, the other transitions presented low or null probabilities (Table 1). Similar to the above, water, agriculture and urban coverage were the most stable in the period 2003-2010, on the other hand, with the transitions of coverage occurring with the highest probability being those of scrub and forest to agriculture (Table 2). Unlike the two previous periods and with average values, during 2010-2016 the most stable coverage was agriculture and urban. In this very dynamic period, a probability of scrub towards agriculture was observed (Table 3).
Among the observed periods, the system that occurred between 2010-2016 was that one which presented the greatest dynamism (values from the diagonal away to 1). Furthermore, it is observed how agriculture plays a primary role in the land-use dynamics in Sub-basin III. The stability or increase in demand has been favored by the allocation of credits to farmers, which has allowed the establishment of pineapple and pitahaya crops, and the decrease in shady coffee and forest areas (ALMA, 2008). Thus, people’s responses to economic opportunities mediated by institutional factors drive changes in land cover (Lambin et al., 2003; Lambin and Meyfroidt 2010, Zhu, et al., 2010), and thus Agriculture coverage becomes an agent of deforestation in tropical developing countries (Lambin and Geist, 2006).
On the other hand, the stability or increase in demand for urban coverage in the three periods observed is probably influenced by the approval of Law 677 on the Promotion and Access to Housing of Social Interest, and by the housing policies that have promoted the Urbanizing Chamber of Nicaragua. This has facilitated that approximately 180 urban projects are located in the lower part of the study area, thus generating an average density of 19 homes per hectare equivalent to 95 inhabitants per hectare (ALMA, 2008).
During the 2016-2025 period (simulated, table 4), the same dynamic trend is forecast for the 2010-2016 period, except forest and scrub cover, which showed an increase and decrease in their stability, respectively.
On the other hand, the study area is forecast to increase by 30% more than the population in 2025 compared to 2005 (ALMA, 2008). The dynamism that may occur in urban coverage during the 2016-2025 period indicates that it is possible to offset a population increase in Sub-basin III. In this way agriculture will continue to be a central activity at the expense of permanent deforestation and the urban areas of Managua will continue to comply with the principle of market service and the municipalities that are part of Managua’s Sub-basin III will be recipients of housing growth due to the influence of housing policies promoted in previous years. Similar conclusions confront other regions of the world in which the city’s development policy will lead to the expansion of residential land and the concentration of the population (Gong, et al., 2011, Han, et al., 2015).
Table 1. Markovian probability matrix for the period 1997-2003
|
tn+1 |
2003 |
||||||
|
tn |
A |
B |
Ag |
U |
M |
Pi+ |
|
|
1997 |
Water |
1.000 |
0.000 |
0.000 |
0.000 |
0.000 |
1.000 |
|
Forest |
0.000 |
0.298 |
0.598 |
0.037 |
0.067 |
1.000 |
|
|
Agriculture |
0.001 |
0.112 |
0.743 |
0.095 |
0.048 |
1.000 |
|
|
Urban |
0.000 |
0.001 |
0.248 |
0.727 |
0.025 |
1.000 |
|
|
Scrubs |
0.041 |
0.045 |
0.345 |
0.315 |
0.254 |
1.000 |
|
W= Water, F=Forest, Ag= Agriculture, U= Urban, B= Scrubs
Table 2. Markovian probability matrix for the period 2003-2010
|
tn+1 |
2010 |
||||||
|
tn |
A |
B |
Ag |
U |
M |
Pi+ |
|
|
2003 |
Water |
0.880 |
0.000 |
0.020 |
0.000 |
0.100 |
1.000 |
|
Forest |
0.000 |
0.557 |
0.393 |
0.013 |
0.038 |
1.000 |
|
|
Agriculture |
0.000 |
0.141 |
0.731 |
0.101 |
0.027 |
1.000 |
|
|
Urban |
0.000 |
0.018 |
0.294 |
0.645 |
0.043 |
1.000 |
|
|
Scrubs |
0.006 |
0.213 |
0.427 |
0.158 |
0.196 |
1.000 |
|
W= Water, F=Forest, Ag= Agriculture, U= Urban, B= Scrubs
Table 3. Markovian probability matrix for the period 2010-2016
|
tn+1 |
2016 |
||||||
|
tn |
A |
B |
Ag |
U |
M |
Pi+ |
|
|
2010 |
Water |
0.039 |
0.000 |
0.022 |
0.013 |
0.926 |
1.000 |
|
Forest |
0.000 |
0.252 |
0.590 |
0.039 |
0.120 |
1.000 |
|
|
Agriculture |
0.000 |
0.067 |
0.697 |
0.123 |
0.114 |
1.000 |
|
|
Urban |
0.000 |
0.020 |
0.186 |
0.693 |
0.100 |
1.000 |
|
|
Scrubs |
0.000 |
0.038 |
0.336 |
0.180 |
0.446 |
1.000 |
|
W= Water, F=Forest, Ag= Agriculture, U= Urban, B= Scrubs
Table 4. Markovian probability matrix for the period 2016-2025
|
tn+1 |
2025 |
||||||
|
tn |
A |
B |
Ag |
U |
M |
Pi+ |
|
|
2016 |
Water |
0.000 |
0.000 |
0.150 |
0.000 |
0.850 |
1.000 |
|
Forest |
0.000 |
0.511 |
0.462 |
0.018 |
0.008 |
1.000 |
|
|
Agriculture |
0.000 |
0.210 |
0.634 |
0.129 |
0.027 |
1.000 |
|
|
Urban |
0.000 |
0.041 |
0.267 |
0.642 |
0.050 |
1.000 |
|
|
Scrubs |
0.000 |
0.156 |
0.458 |
0.204 |
0.183 |
1.000 |
|
W= Water, F=Forest, Ag= Agriculture, U= Urban, B= Scrubs
Effect of biophysical and socioeconomic variables on the dynamics of land cover
The transitions of a land cover are conditioned by the effect of a complex of biophysical and socioeconomic variables that vary over time (Tables 5, 6, 7, 8). During the periods evaluated, the forest cover transitions constantly depended on the significant influence of the variables altitude, distance to the road and distance to the city, although the direction of the effect was not the same in time.
Thus, for example, the elimination of forest cover was extended to higher altitude sites during the first two periods evaluated, this translates into deforestation during those years, but the situation changed, increasing said cover at those altitudes in the last period. And is that the increase in elevation and the upward slope is positively related to the presence of forest (Oprsal, Kladivo, & Machar, 2016), although the altitude variable also conditions the loss of forest to open agricultural spaces (Pineda, et al., 2011; Rudel, et al., 2009). On the other hand, it was observed that the influence and the direction of the effect of the variables distance to drainage, slope, and previous land cover were not constant during the different periods. In this way, it was observed that the forest cover transitions were not affected by the distance to the drainage network in the period. However, in the following two periods, the forest cover increased or decreased as the distance to the drainage network increased.
The transitions of agriculture coverage can be explained by most of the evaluated variables which showed constancy in the direction of the effect in all periods. Thus, shifts to agricultural land are favored at higher altitudes, away from roads and urban centers, and on flat terrain. Thus, for example, other studies have confirmed that less favorable topographic conditions are key to extension and land abandonment not only in marginally agricultural mountainous areas but also in those with an intensive agricultural tradition (Oprsal, et al., 2016). Likewise, the construction of new highways stimulate agricultural expansion (Pineda, et al., 2011; Rudel, et al., 2009), and the distance to urban centers in another key variable for the location of agricultural land (Pazúr, et al., 2015) probably due to the importance of transportation costs in the general spatial pattern of land cover (Alarcón, 2006). Transitions to urban coverage were affected by most of the variables, but the direction of the effects varied over time. Thus, in the first period evaluated, urban development was favored by the proximity to the drainage network of Sub-basin III of Managua, however, during the following periods, urban development was favored as the distance to the drainage network increased and decreased the distance to the city, which coincides with what happens in other regions (Fuchs et al., 2013). On the other hand, at the highest elevations, the geographical environment limits the expansion of urban coverage, although the trend is increasing demand for urban coverage in mountainous areas (Han, et al., 2015).
As in the other transitions, those related to scrub cover were affected to a different extent by the complex of variables studied and whose effects were not constant over time. Except for the land slope and previous land cover variables that exerted an incremental effect on scrub cover, the other variables showed bidirectional effects on this cover in the different periods.
Table 5. Estimated effects of the logistic regression model for forest cover transitions.
|
Cover/Forest |
Period |
||
|
1997-2003 |
2003-2010 |
2010-2016 |
|
|
Parameter |
Effect Pr (>|z|) |
Effect Pr (>|z|) |
Effect Pr (>|z|) |
|
Intercept |
- |
+ |
- |
|
Altitude |
- |
- |
+ |
|
Distance to road |
- |
- |
+ |
|
Distance to the city |
+ |
- |
+ |
|
Drain distance |
ns |
+ |
- |
|
Slope |
+ |
ns |
+ |
|
Previous land cover |
ns |
- |
- |
Coefficient: Effects: positive (+) or negative (-) with a significance of P <0.05, ns: Not significant.
Table 6. Estimated effects of the logistic regression model for agriculture coverage transitions
|
Cover/Agriculture |
Period |
||
|
1997-2003 |
2003-2010 |
2010-2016 |
|
|
Parameter |
Effect Pr (>|z|) |
Effect Pr (>|z|) |
Effect Pr (>|z|) |
|
Intercept |
ns |
- |
+ |
|
Altitude |
+ |
+ |
+ |
|
Distance to road |
+ |
+ |
+ |
|
Distance to the city |
+ |
+ |
+ |
|
Drain distance |
+ |
+ |
- |
|
Slope |
- |
- |
- |
|
Previous land cover |
ns |
- |
+ |
Coefficient: Effects: positive (+) or negative (-) with a significance of P <0.05, ns: Not significant.
Table 7. Estimated effects of the logistic regression model for the transitions of the urban cover.
|
Cover/Urban |
Period |
||
|
1997-2003 |
2003-2010 |
2010-2016 |
|
|
Parameter |
Effect Pr (>|z|) |
Effect Pr (>|z|) |
Effect Pr (>|z|) |
|
Intercept |
ns |
- |
- |
|
Altitude |
- |
+ |
ns |
|
Distance to road |
- |
- |
- |
|
Distance to the city |
- |
- |
- |
|
Drain distance |
- |
+ |
+ |
|
Slope |
- |
- |
- |
|
Previous land cover |
ns |
+ |
+ |
Coefficient: Effects: positive (+) or negative (-) with a significance of P <0.05, ns: Not significant.
Table 8. Estimated effects of the logistic regression model for transitions in scrub cover.
|
Cover/Scrubs |
Period |
||
|
1997-2003 |
2003-2010 |
2010-2016 |
|
|
Parameter |
Effect Pr (>|z|) |
Effect Pr (>|z|) |
Effect Pr (>|z|) |
|
Intercept |
ns |
ns |
- |
|
Altitude |
+ |
ns |
- |
|
Distance to road |
+ |
- |
+ |
|
Distance to the city |
- |
- |
+ |
|
Drain distance |
- |
- |
+ |
|
Slope |
+ |
+ |
ns |
|
Previous land cover |
ns |
+ |
+ |
Coefficient: Effects: positive (+) or negative (-) with a significance of P <0.05, ns: Not significant.
Evaluation and validation of the land cover dynamics model
The evaluation of the results derived from the logistic regression model for each land cover and period evaluated presents a good fit, reflected by the values of the area under the curve (AUC ~ 1). Similar results were obtained by Molds et al., (2015).
The demand for each coverage is properly simulated, but the transitional spatial distribution of each coverage does not occur that way. Thus, the real surface demand for agricultural coverage was 56.4% for 2010 and the simulation assigned 60.5% for the same year observed. However, the simulation for urban coverage is acceptable because the difference between the demand and the simulated was 0. Conversely, the maximum uncertainty is observed for water coverage, where the real demand was 0.55%, while, in the simulation was 0.02%. On the other hand, the transitional spatial distribution of each coverage is not located correctly on the simulated map. For example, some urbanization sites located in the middle part of the reference map (year 2010) do not appear on the simulated map (year 2010). To improve spatial simulation, it is recommended to include demographic and government planning explanatory variables (Pontius, Gil, & Schneider, 2001; Verburg et al., 2002; Gong, et al., 2011).
CONCLUSIONS AND RECOMMENDATIONS
During the evaluated period (1997-2025) agriculture predominates in the area of Sub-basin III with few oscillations during the time. The results for the simulated period (2016-2025) indicate an increase in forest and urban areas. The estimated transitions during the different periods observed reflect a high dynamism between the land covers. During the simulation, and with few exceptions, a similar dynamism was observed concerning the last observed period. Furthermore, the biophysical and socioeconomic variables explain the land cover transitions in Sub-basin III of Managua. However, the influence and changes in the direction of the effects were not constant in the evaluated periods. Additionally, the validation results indicate that the land cover change model was acceptable. Future research will study the possibility of spatially operationalizing variables of a sociopolitical nature that contribute to reducing uncertainty and provide more accurate projections.
THANKS
To the Universidad Nacional Autónoma de Nicaragua, UNAN-Managua, which financed this study through the Research Projects Fund (FPI).
Works Cited
Alarcón, L. (2006). Factores, predicciones e implicaciones en la asignación de usos de suelo: revisión y reflexiones. Cuadernos de Investigación Geográfica. Cuadernos de Investigación Geográfica, 32, 147-160. https://dialnet.unirioja.es/descarga/articulo/2283774.pdf
ALMA. (2008). Actualización del estudio de drenaje pluvial de la Subcuenca III de la cuenca sur del lago de Managua. Informe final para la municipalidad de Managua, Alcaldía de Managua, Managua, Nicaragua.
Chuvieco, E. (2010). Teledetección Ambiental (Tercera ed.). Barcelona, España: Ariel.
FAO. (1996). Forest Resource Assessment Programme 1990, Survey of Tropical Forest Cover and Study of Change Processes. (F. a. Nations, Ed.) http://www.fao.org/docrep/007/w0015e/w0015e00.htm
Fuchs, R., Herold, M., Verburg, P. H., y Clevers, G. (2013). A high-resolution and harmonized model approach for reconstructing and analysing historic land changes in Europe. Biogeosciences, 10(3), 1543-1559. doi:10.5194/bg-10-1543-2013
Gong, C., Juquuan, C., y Shixiao, Y. (2011). Spatiotemporal dynamics of urban forest conversion through modelurbanization in Shenzhen, China. International Journal of Remote Sensing, 32(24), 9071–9092. doi:10.1080/01431161.2010.549848
Han, H., Yan, C., y Song, J. (2015). Scenario Simulation and the Prediction of Land Use and Land Cover Change in Beijing, China. (Y. D. Wei, Ed.) Sustainability, 7(4), 4260-4279. doi:10.3390/su7044260
Henríquez, C., Azócar, G., y Aguayo, M. (2006). Cambio de uso de la tierra y escorrentía superficial: aplicación de un modelo de simulación espacial en Los Ángeles, VIII Región del Biobío, Chile. Geografía Norte Grande(36), 61-74. http://www.redalyc.org/comocitar.oa?id=30003604
Lambin , E. F., Geist , H. J., y Lepers , E. (2003). Dynamics of land-use and land-cover change in tropical regions. Annual Review of Environment and Resources, 28(1), 205-241. doi:10.1146/annurev.energy.28.050302.105459
Lambin , E., y Meyfroidt , P. (2010). Land use transitions: Socio-ecological feedback versus socio-economic change. 27(2), 108-118. doi:10.1016/j.landusepol.2009.09.003
Lambin, E. F., y Geist, H. (2006). Land Use and Land Cover Change. Springer-Verlag Berlin Heidelberg. http://www.sysecol2.ethz.ch/AR4_Ch04/Ch4-GreyLit/Al66.pdf
Lambin, E. F., Meyfroidt, P., Rueda, X., Blackman, A., Borner, J., Cerutti, P. O., Wunder, S. (2014). Effectiveness and synergies of policy instruments for land use governance in tropical regions. Global Environmental Change, 28, 129-140. doi:10.1016/j.gloenvcha.2014.06.007
Lambin, E. F., Turner, B. L., Helmu, J., Geist, H. J., Agbola, S. B., Angelsen, A., . . . Xu, J. (2001). The causes of land-use and land-cover change:moving beyond the myths. Global Environmental Change(11), 261-269. https://dirzolab.stanford.edu/wp-content/articles/A_2001/52_2001_GlobEnvironChange.pdf
Moulds, S., Buytaert, W., y Mijic, A. (2015). An open and extensible framework for spatially explicit land use change modelling: the lulcc R package. Geoscientific Model Development(8), 3359–3402. doi:10.5194/gmdd-8-3359-2015
Oprsal , Z., Kladivo , P., y Machar , I. (2016). The role of selected biophosical factors in long-term land-use chance of cultural landscape. Apploed Ecology and Evironmental Research, 14(2), 23-40. doi:doi.org/10.15666/aeer/1402_023040
Overmars, K. P., de Koning, G. H., y Veldkamp. (2003). Spatial autocorrelation in multi-scale land use models. Ecological Modelling, 257-270. doi:10.1016/S0304-3800(03)00070-X
Pazúr, R., Otahel, J., y Maretta, M. (2015). The distribution of selected CORINE land cover clases in different natural landscapes in Slovakia: Methodological framework and applications. Moravian Geographical Reports, 23(1), 45-56. doi:10.1515/mgr-2015-0005
Peña, L. J. (2007). Efectos ecológicos de los cambios de coberturas y usos del suelo en la marina Baixa (Alicante). Tesis para optar al grado de Doctor en Biología, UA, Alicante, España. https://www.pik-potsdam.de/news/public-events/archiv/alter-net/alumni/tesis-juanpena.pdf
Pineda, J. B., Bosque, J., Gómez, D., y Plata, R. (2011). Analysis of the causative factors behind changes to forest cover in the state of mexico from 1993 to 2000. Boletín de la Asociación de Geógrafos Españoles, 56, 399-402. https://dialnet.unirioja.es/servlet/articulo?codigo=3722095
Pontius, R. G., Peethambaram, S., y Castella, J. C. (2011). Comparison of Three Maps at Multiple Resolutions: A Case Study of Land Change Simulation in Cho Don District, Vietnam. Annals of the Association of American Geographers, 101(1), 45-62. doi:10.1080/00045608.2010.517742
Pontius, R., Gil, J., y Schneider, L. C. (2001). Land-cover change model validation by an ROC method for the Ipswich watershed, Massachusetts, USA. Agriculture, Ecosystems and Environment, 85(1-3). doi:10.1016/S0167-8809(01)00187-6
R Core Team. (2019). R: A language and environment for statistical computing. Viena, Austria: R Foundation for Statistical Computing. https://www.R-project.org/.
Rudel, T. K., Schneider, M., Uriarte, B. L., Turner, D. R., Lawrence, D., Geoghegan, J., . Grau, R. (2009). Agricultural intensification and changes in cultivated areas 1970-2005. Proceedings of the National Academy of Sciences of the United States of America, 110(49), 20675–20680. doi:10.1073pnas.0812540106
Satake , A., y Rudel, T. K. (2007). Modeling the Forest Transition: Forest Scarcity and Ecosystem Service Hypotheses. Ecological Applications, 17(7), 2024-2036. doi:10.1890/07-0283.1
Veldkamp, A., y Lambin, E. (2001). Predicting land-use change. Agriculture, ecosystems and environment, 1-6. doi:10.1016/S0167-8809(01)00199-2
Verburg, P. H., Rousenvell, D. A., y Veldkamp, A. (2006). Scenario-based studies of future land use in Europe. Agriculture, Ecosystems y Environment, 114(1), 1-6. doi:10.1016/j.agee.2005.11.023
Verburg, P. H., Soepboer, W., Veldkamp, Limpiada, A., y Mastura, S. (2002). Modeling the spatial dynamics of regional land use: the CLUE-S model. Environmental Management, 30(3), 391-405. doi:DOI: 10.1007/s00267-002-2630-x
Zhu, Z., Liu, L., Chen, Z., Zhang, J., y Verburg, P. H. (2010). Land-use change simulation and assessment of driving factors in the loess hilly region—a case study as Pengyang County. Environmental Monitoring and Assessment, 164(1-4), 133-142. doi:10.1007/s10661-009-0880-2